
A big part of your report is the benchmarking element which is in three main areas:
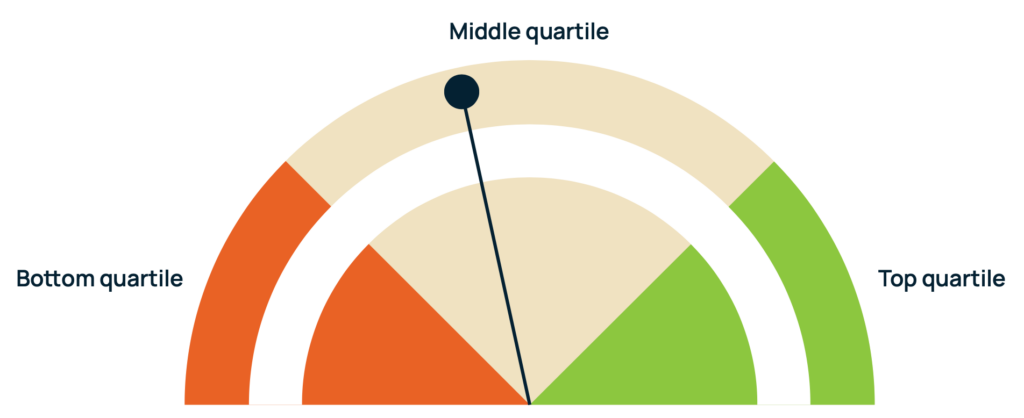
We use a colour-coding system to rank items, factors, and overall effectiveness in three categories:
If your board’s average response is sufficiently below the average response of directors of comparable boards, your board will be rated in the bottom quartile and the colour red will be assigned to that survey item or board effectiveness factor. The converse is also true.
If there is a large variation in the view of your board members on the same survey item matter than large variation often causes the average response of your board members to be below the average response of other similar boards and accordingly to be rated in the bottom quartile. Also, if your board includes one or two outliers in relation to several survey items those survey items are also likely to be rated on the bottom quartile for the same reason.
Average responses to each survey item differ as some items are easier to agree with, resulting in a higher average response, just as items that are harder to agree with see lower average responses. This means that the same profile of director responses won’t always result in the same benchmarking for different survey items. It can also mean that a better profile of director responses is not always associated with a more desirable colour.
As stated above, outliers in relation to specific survey items can drag down the average director response. For example, there may be one or more directors giving responses that are much more negative when compared to other directors. This can result in a bottom quartile rating and therefor the color red for that particular item.
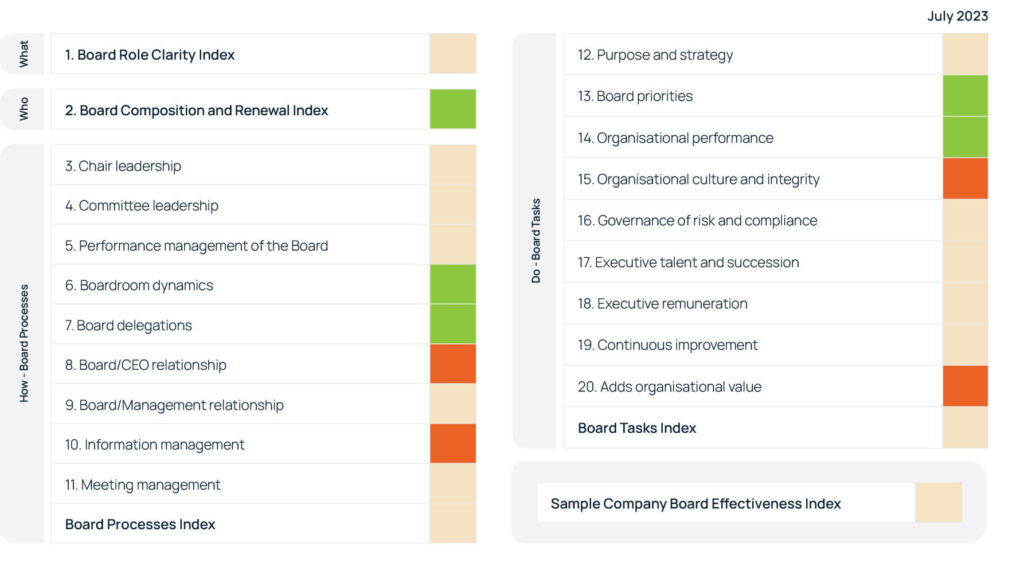
Our world recognised WhatWhoHowDo Framework for board effectiveness has set out the most important matters that impact a board’s performance, effectiveness and decision making. With our research and this framework, we can ensure that your board’s performance is being rated against the elements that truly matter.
Furthermore, our global network of experts are always available to advise you on how to interpret the report and act on the critical areas for positive growth and performance improvement.
To learn more about the WhatWhoHowDo Framework click here.
The 20 areas of a board’s effectiveness are explained in detail here. Because many of these factors manifest themselves “behind closed doors” and because little is known about the effectiveness of boards at some of these processes, benchmarking using validated surveys can help boards more easily understand their effectiveness in each of the areas.