

You’ve already made the smart decision to carry out a benchmarked board effectiveness survey to measure the effectiveness and performance of your board. From here, you need to interpret and act on your report in such a way that the entire process becomes valuable for your board and organisation.
To help, we’ve provided some assistance below to ensure you do this correctly. This will help you gain a little more understanding about your report, and as always, our team is on-hand to answer any questions you may have.
Understanding the benchmarking process
A big part of your report is the benchmarking element which is in three main areas:
- Overall benchmarking of your board (Section 2)
- The 16 factors of effectiveness (Section 3)
- The benchmarking of each survey item (Section 5)
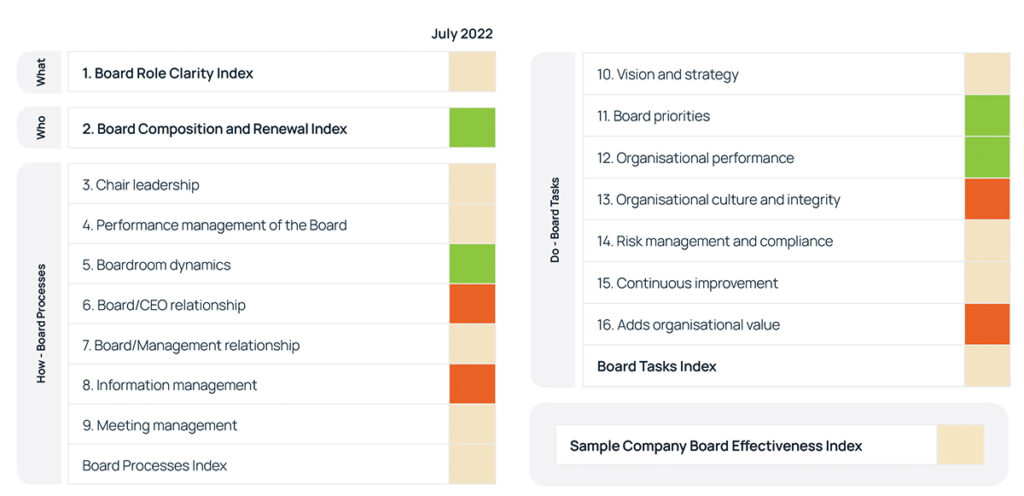
We use a colour-coding system to rank items, factors, and overall effectiveness in three categories:
- Bottom quartile (red). This means your board is less effective in this area than similar boards
- 2nd and 3rd quartile (beige). This means your board is similar in effectiveness in this area to comparable boards
- Top quartile (green). This means your board is more effective in this area than similar boards
If your board’s average response is sufficiently below the average response of directors of comparable boards, your board will be rated in the bottom quartile and the colour red will be assigned to that survey item or board effectiveness factor. The converse is also true.
If there is a large variation in the view of your board members on the same survey item matter than large variation often causes the average response of your board members to be below the average response of other similar boards and accordingly to be rated in the bottom quartile. Also, if your board includes one or two outliers in relation to several survey items those survey items are also likely to be rated on the bottom quartile for the same reason.
Things to consider about average response ratings
Average responses to each survey item differ as some items are easier to agree with, resulting in a higher average response, just as items that are harder to agree with see lower average responses. This means that the same profile of director responses won’t always result in the same benchmarking for different survey items. It can also mean that a better profile of director responses is not always associated with a more desirable colour.
As stated above, outliers in relation to specific survey items can drag down the average director response. For example, there may be one or more directors giving responses that are much more negative when compared to other directors. This can result in a bottom quartile rating and therefor the colour red for that particular item.
TheWhatWhoHowDo framework
Our world recognised WhatWhoHowDo framework for board effectiveness has set out the most important matters that impact a board’s performance, effectiveness and decision making. With our research and this framework, we can ensure that your board’s performance is being rated against the elements that truly matter.
Furthermore, our global network of experts are always available to advise you on how to interpret the report and act on the critical areas for positive growth and performance improvement.
Try our FREE survey and continue to gather more insights
Board Surveys has developed a FREE shortened single user board survey and a FREE benchmarked report for you to try. Give it a try – it will take you less than 3 minutes! You can share it with your fellow directors too and compare results. Better still, get you whole board to complete one of our benchmarked Board Effectiveness Surveys to help you kick start your improvement journey.
Our additional articles, research papers, and insights will help ensure you interpret and act on your report effectively with the goal of becoming a better board.
We also recommend that you subscribe to receive our insights for an easy way to stay informed and ensure top quartile performance across all areas of board activity.